Carbon FootPrint - Atlantis Headwear
Home Projects Carbon FootPrint
CARBON FOOTPRINT
a further step in reducing the impact of today and tomorrow
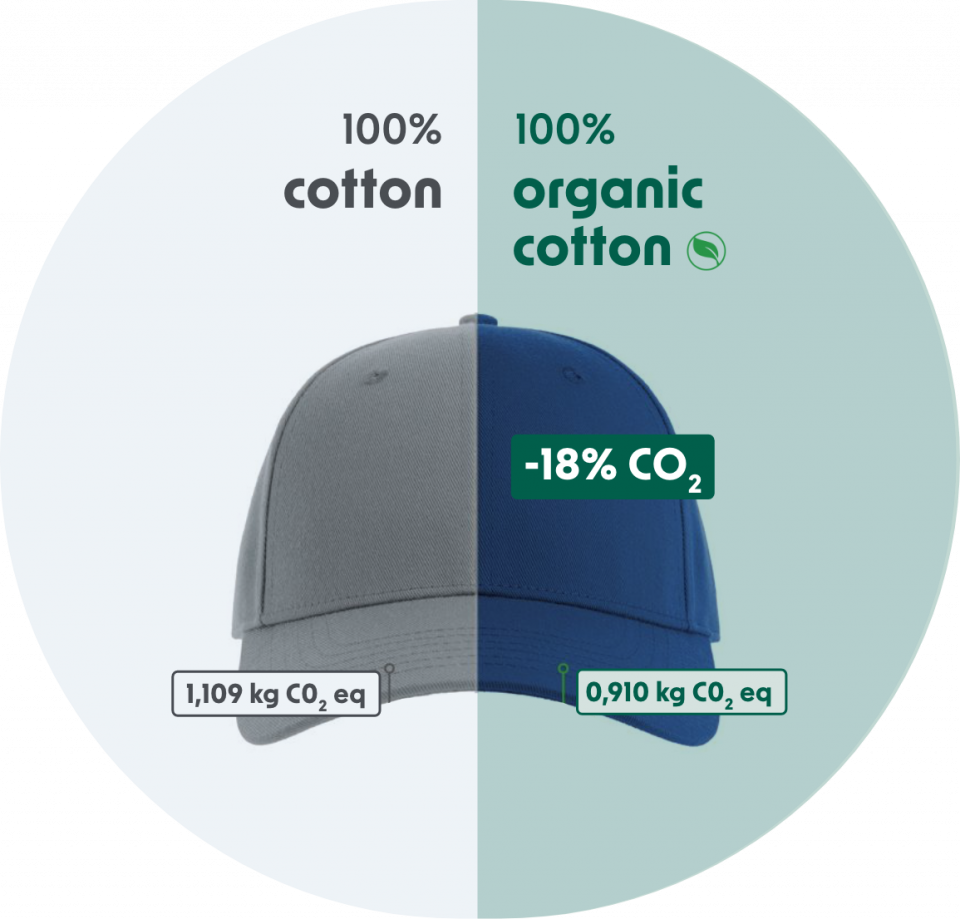
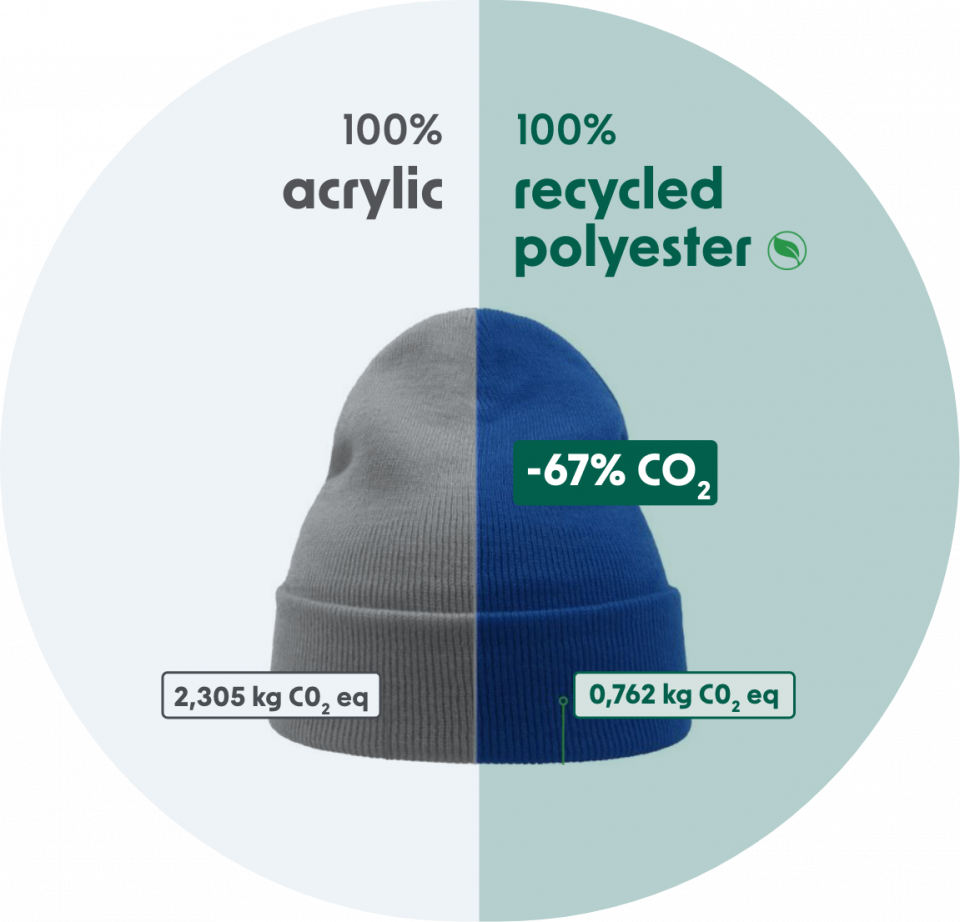
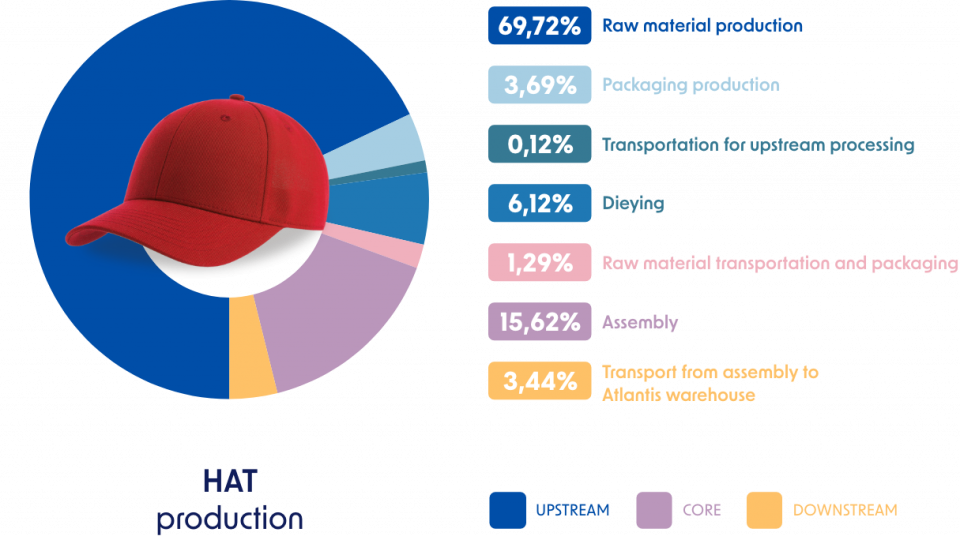
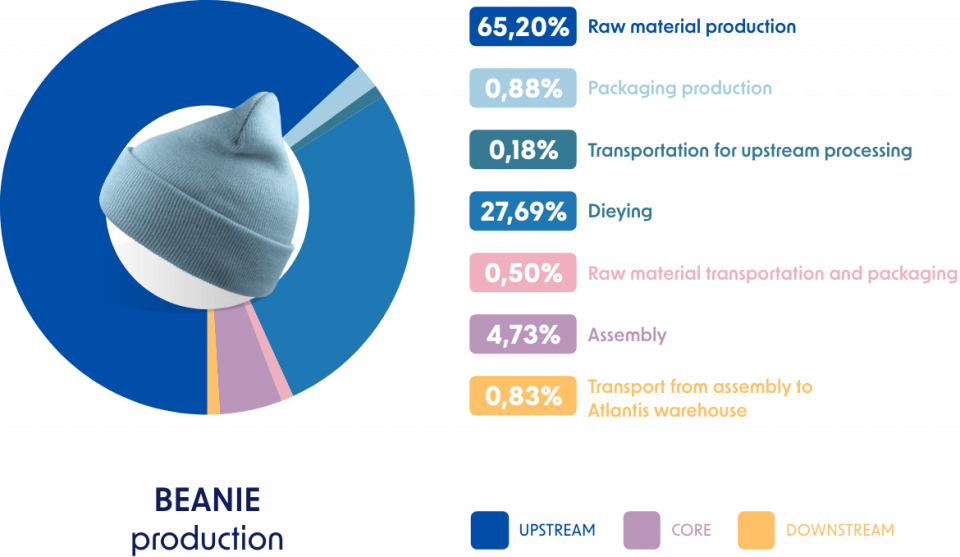
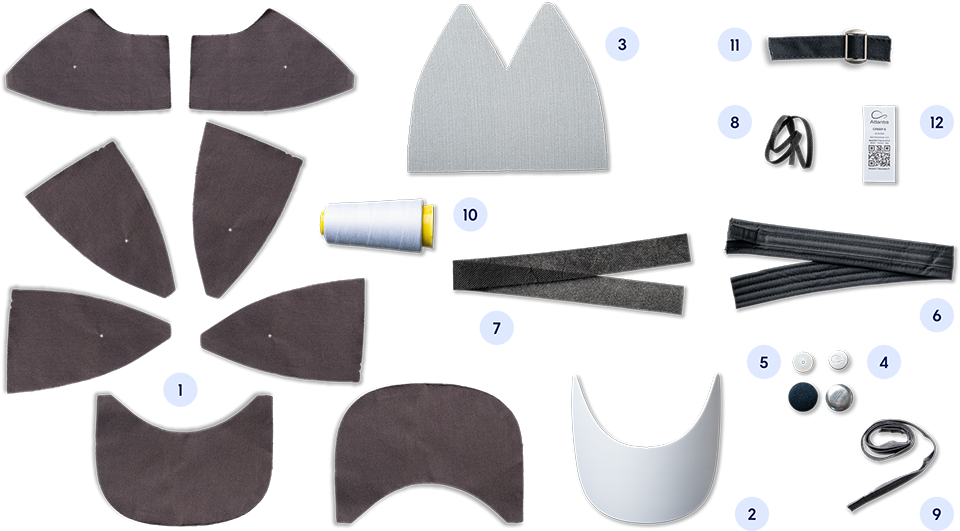
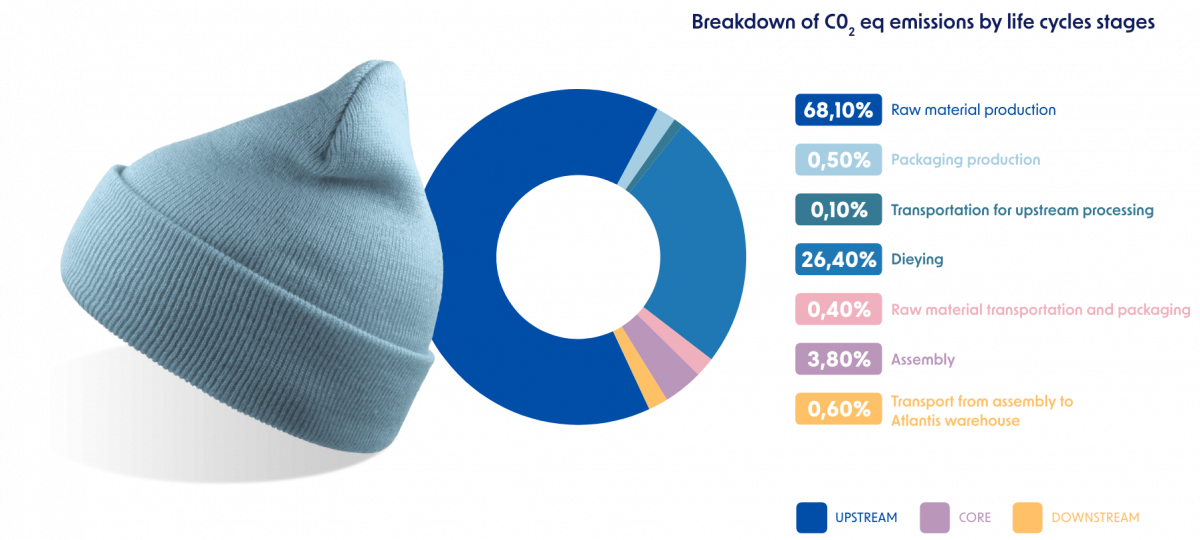
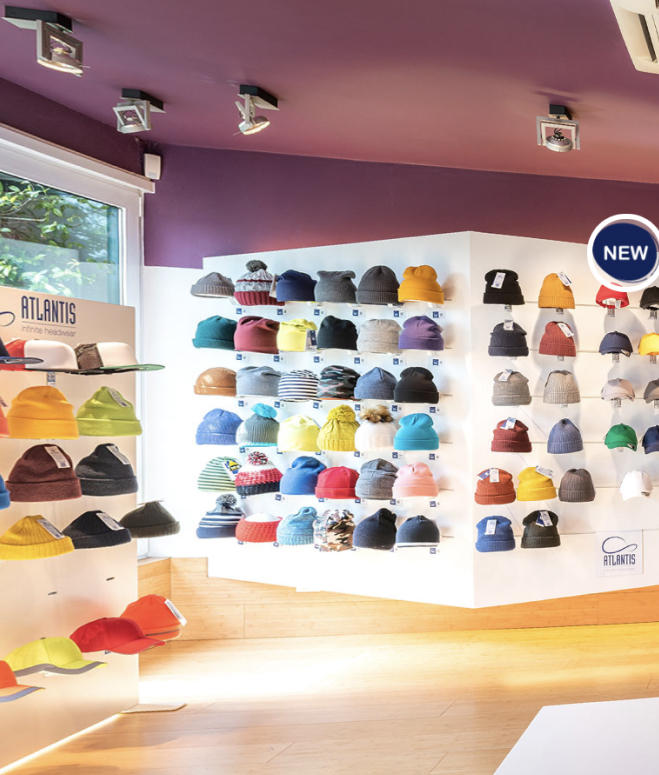
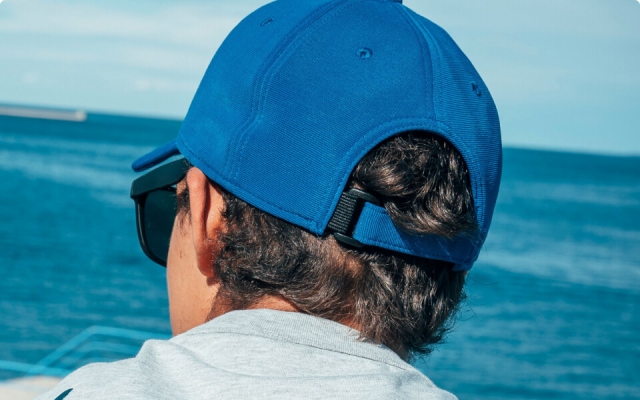
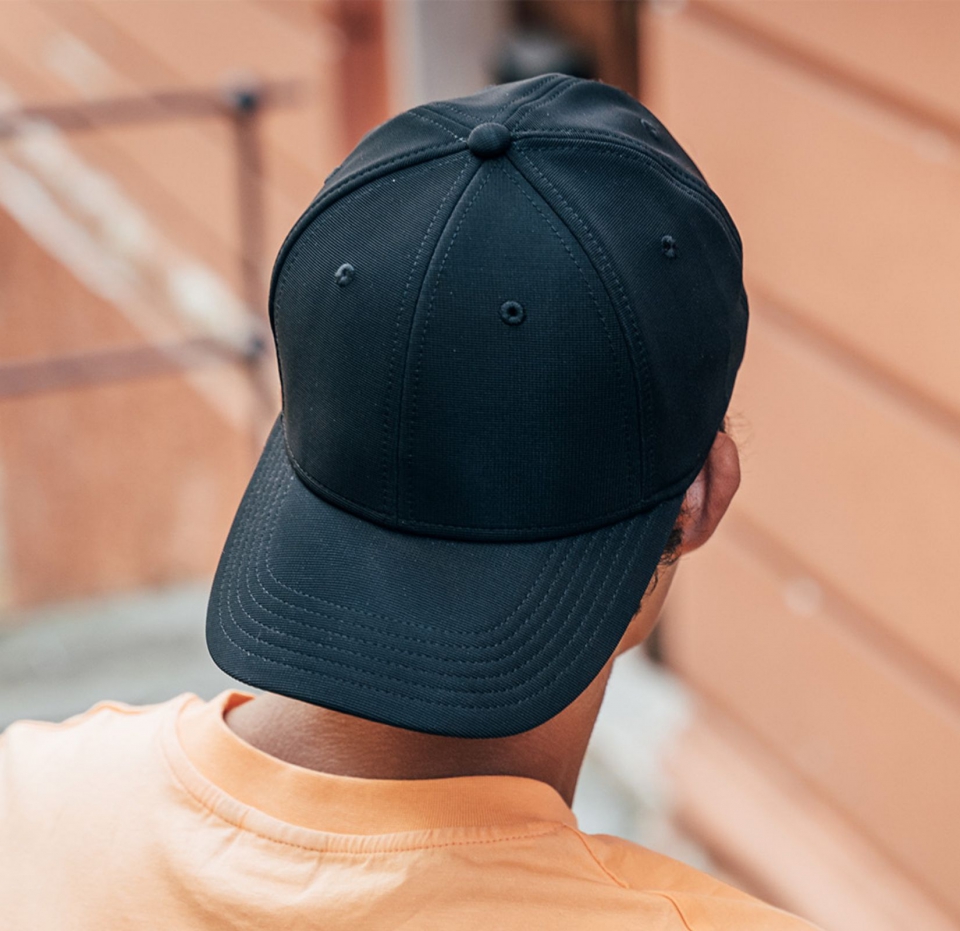
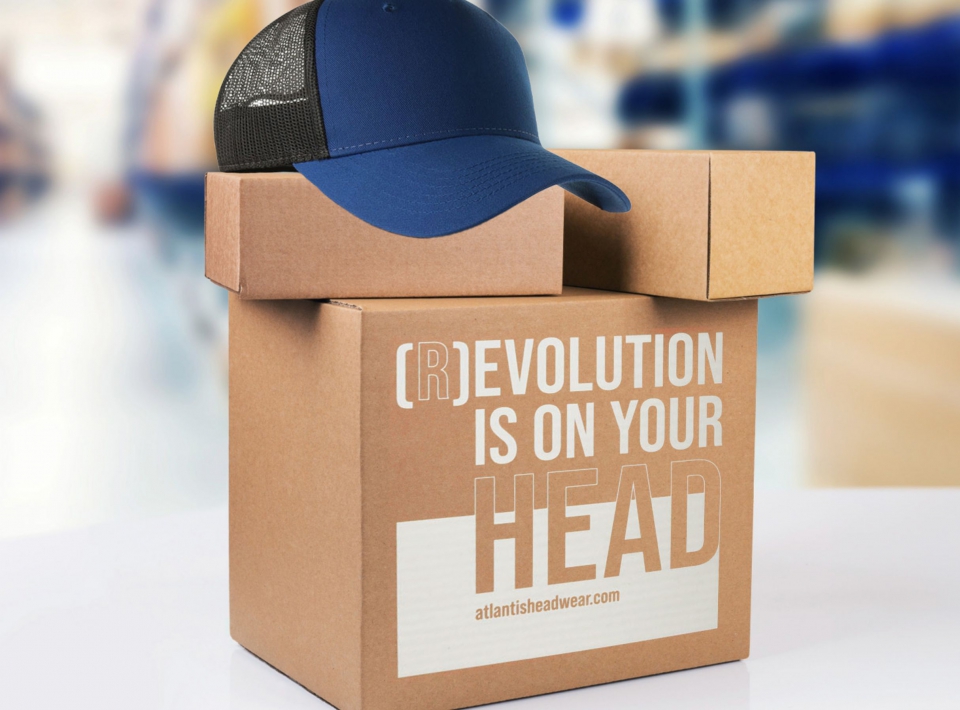
As a company that designs and distributes hats and beanies, we are aware that our items generate an impact on the environment and people. Based on this realization, we decided to embark on a path to reduce our impact as much as possible.

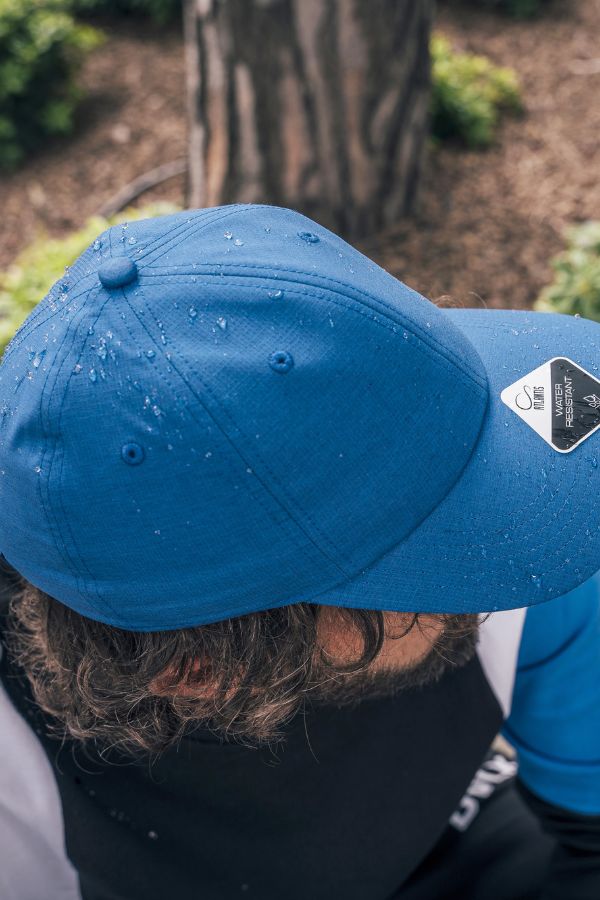
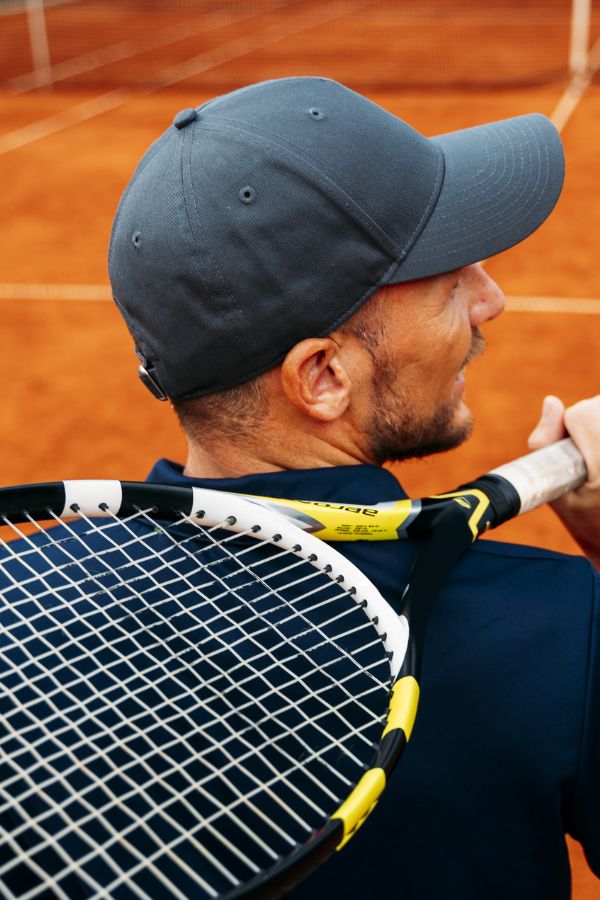
Our goal is set for 2025: to reduce the environmental impact of all Atlantis-branded products compared to current versions.

Where does this revolution start?

The first step was to understand and analyze what most represents us: our hats.

According to the European Commission, Life Cycle Assessment (LCA) is currently the best framework available for assessing the potential environmental impacts of products by considering their entire life cycle. In fact, LCA is a structured and internationally standardized methodology that quantifies the impacts associated with the life cycle of a good or service according to codified and recognized indicators, including the carbon footprint.

There are several studies available for textile products, but none that we felt were close to our reality. So, we carried out a specific LCA on the most representative products of the Atlantis brand. It is a study that we have been working on for more than a year, including evaluations, data collection and in-depth analysis, also made possible by the close collaboration with our supply chain.

The result?

As a result of this study, we obtained a quantification of the Carbon Footprint (CFP) of our products and, at the end of 2022, this data was third-party certified according to ISO 14067: 2018 (Greenhouse gases Carbon footprint of products Requirements and guidelines for quantification), verification certificate CFP51/22. The analysis allowed us to identify opportunities to improve environmental performance at each stage of the life cycle, providing us with sustainability criteria to ensure more responsible purchasing and production choices, and to draw up a roadmap to achieve our ambitious goal.

Our commitment is to continue to extend the analysis to more and more products, using data and information from scientific papers or tools and software to calculate the carbon footprint, as long as they are in compliance with the ISO 14067 (ISO for PCF), ISO 14044 and ISO 14040:2006 (LCA) standards.

WHY WE CHOOSE LOW-IMPACT PRODUCTS COMPARED TO CONVENTIONAL ONES

THE CARBON FOOTPRINT OF OUR HATS AND CAPS

*The comparative calculation was carried out through the sensitivity analysis reported in the Master Italia Carbon Footprint report, with reference to the WIND and HIT items. The stages from raw material procurement to distribution to Atlantis customers have been considered (weighted average of km per type of hat and for the different modes of transport).
HOW IS THE IMPACT DISTRIBUTED?
a closer look at our products
The results of our LCA study show that material selection, along with energy use along the supply chain, is the most important element in reducing emissions from our products.

But how are carbon dioxide emissions distributed across all the phases analyzed?

The stages of the product life cycle analyzed below are: Upstream (sourcing and processing of raw materials), Core (assembly), Downstream (arrival of goods to Atlantis warehouse).

*The calculation is an average of the CO2e emission results between HIT and RECY FEEL caps for visors, WIND and RIO for beanies, and refers to the Master Italia Carbon Footprint report, taking into account the stages of the product life cycle, from raw material production to product delivery to the Atlantis warehouse.

Breakdown of C02 eq emissions by life cycle phases
It is clear from the study that the upstream phase of raw material sourcing and processing appears to have the greatest impact on the overall life cycle of our products. When we talk about raw materials for Atlantis products, we mean all the textile and non-textile components that are then used to make a cap, excluding packaging. While some products are less articulated, baseball caps are among the most complex..

Based on this data, we looked at the incidence of each component in the total emissions of the raw material production, in order to identify those that needed to be addressed as a priority. The result was that yarn and fabric had the highest incidence, followed by the visor, which also contributed to the weight of the hat.

In this way, it was possible to identify the priority elements on which to intervene in order to reduce the impact of the products, especially the more complex ones such as baseball caps.

CO2EQ DISTRIBUTION OF THE RAW MATERIAL FOR A BASEBALL CAP

1
Cotton fabric (57,6%)
2
Plastic visor (10,7%)
3
Buckram fabric (4,8%)
4
Metal button (0,4%)
5
Plastic top botton (0,3%)
6
Sweatband fabric (16,1%)
7
Sweatband polyester padding (0,9%)
8
Polyester sizer (0,7%)
9
Taping (3,2%)
10
Polyester Sewing Thread (1,6%)
11
Metal Sunday-Buckle (3,6%)
12
Paper Inside Label (0,0%)
*The calculation of the percentage of raw materials used refers to the HIIT article in the Master Italia Carbon Footprint report.
CO2EQ DISTRIBUTION OF RAW MATERIAL FOR A KNITTED BEANIE
1
Acrylic yarn (99,9%)
2
Polyester Sawing Thread (0,14%)
3
Paper Inside Label (0,01%)
*The calculation of the percentage of raw materials used refers to the HIIT article in the Master Italia Carbon Footprint report.
WHAT'S THE IMPACT OF EACH HAT?

EVERY HAT HAS ITS OWN STORY

id card

product peculiarities


  • ARTICLE: WIND


  • CARBON FOOTPRINT: 2,248KgCO2 eq*


  • COUNTRY OF PRODUCTION: CINA


  • COMPOSITION: 100% ACRYLIC


  • ITEM WEIGHT: 0,07953Kg


  • MODE OF TRANSPORT: BY SHIP


*Cradle to gate - from raw material sourcing to finished product arrival at Atlantis warehouse

Stay up to date with the world of Atlantis

Join our community! We can't wait to tell you more about our passion, our creations and future projects.
SUBSCRIBE TO OUR NEWSLETTER
discover the contents